Data Visualization in Excel — All Charts & Graphs
Self-paced video training — 8 modules, 34 lessons. Work through it at your own pace — every lesson is real recorded training, not slide-reading.
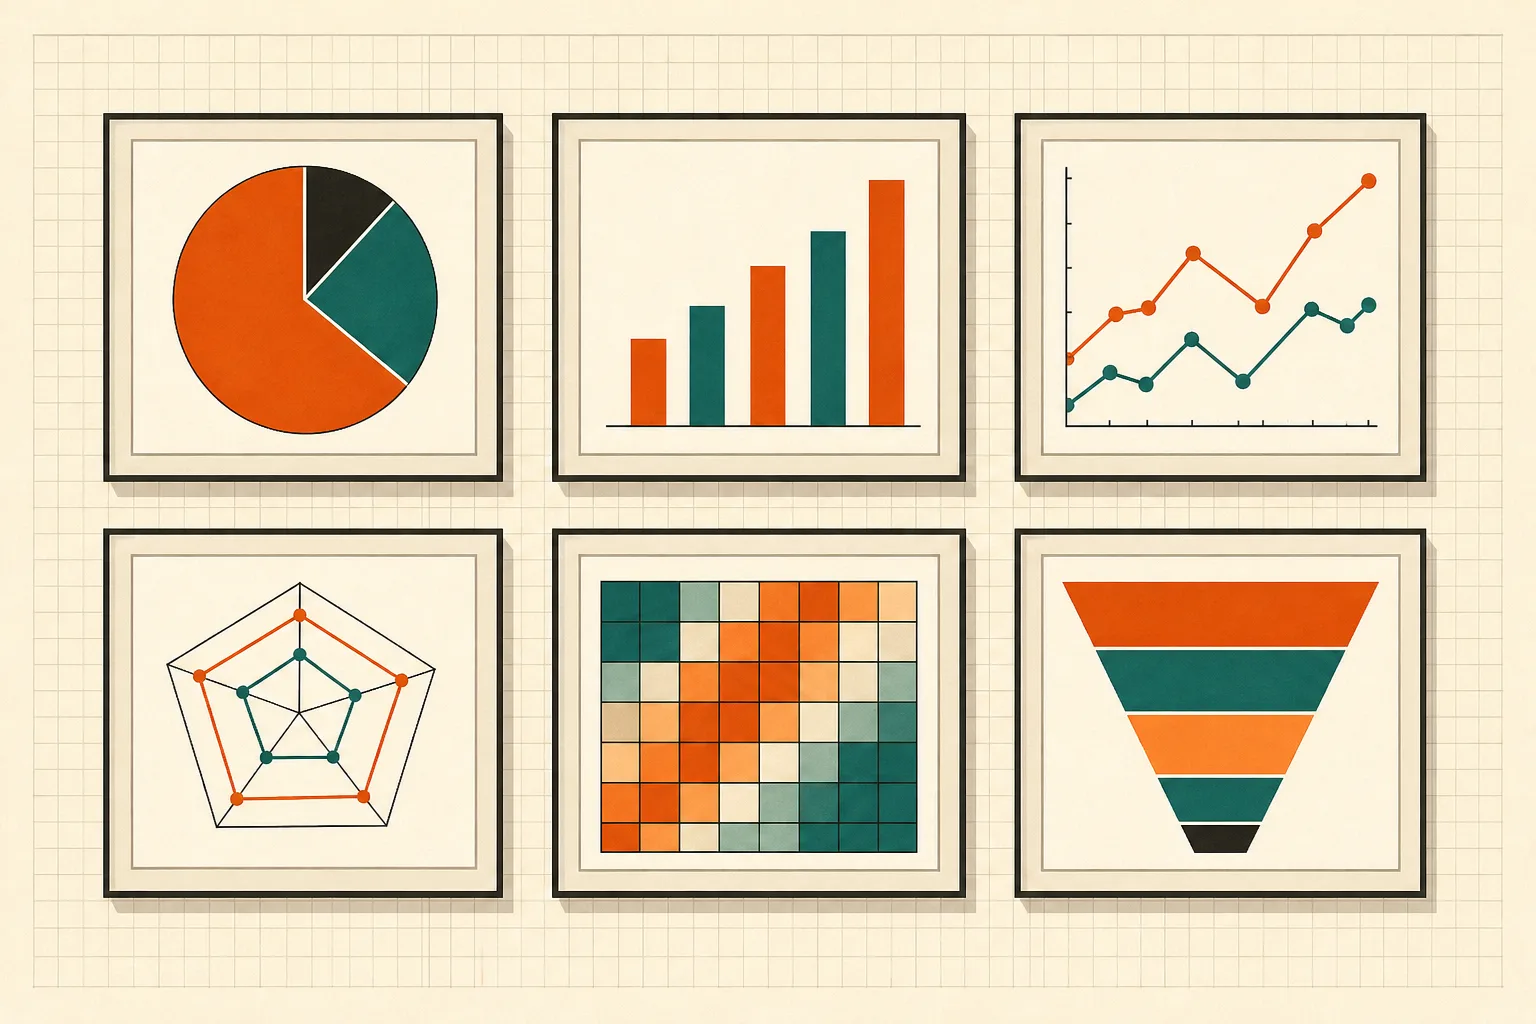 ▶INSIDE THE COURSE · 34 LESSONS
ABOUT THIS COURSE
In this intermediate course on Data Visualization in Excel, students will learn to create and format various types of charts, including bar, line, and pivot charts. The course covers best practices for effective chart design and explores less common chart types like stock and radar charts. Through hands-on exercises, learners will develop the skills to effectively convey data insights through visual representations.
CURRICULUM
8 modules, in order.
01Introduction and basics6 LESSONS
this lesson introduces the course and what to expect in data visualization.
learn about the reasons why charts are essential for data presentation.
this lesson marks a key point in your learning journey.
explore the different types of messages that charts can communicate.
understand the various elements that make up a chart.
discover a simple method for creating charts in Excel.
02Most important Charts Best practices16 LESSONS
get to know the best practices for using bar and column charts.
learn how to format charts effectively for better communication.
explore the best practices specifically for bar charts.
understand the key features of line charts and their usage.
learn how to avoid creating confusing spaghetti plots.
discover the best practices for using area charts effectively.
understand how to use pie and doughnut charts in your data.
learn why it's often better to avoid using pie charts.
explore the features and applications of scatter plots or XY charts.
learn about frequency distribution and how to create histograms.
discover how to effectively use waterfall charts in data storytelling.
learn about hierarchy charts, including sunburst and treemap visualizations.
03Pivot charts2 LESSONS
learn how to create and utilize pivot charts in your analysis.
get introduced to the basics of pivot tables and their functionality.
04Less used charts4 LESSONS
explore stock charts and their specific applications in data visualization.
learn how to create and use radar charts for data visualization.
discover how to utilize surface charts for representing three-dimensional data.
explore heatmaps as a method to visualize data density and patterns.
05Sparklines1 LESSONS
understand how to create and implement sparklines as mini charts.
06Infographics using Excel charts2 LESSONS
learn to design creative infographics using Excel charts.
create a second creative infographic utilizing Excel chart capabilities.
07Appendix Bonus Excel functionalities2 LESSONS
discover how to solve transportation problems using Excel's Goal-Seek feature.
learn to calculate income tax based on slab rates using Excel.
08Bonus Section1 LESSONS
complete the course with the final milestone project.
CURATED BY
Selected from experienced educators' training libraries and kept whole — modules, worked examples and walkthroughs exactly as taught.
GOOD TO KNOW
Lessons stream in the browser and remember where you stopped.
Watch on two devices at once — phone, tablet or desktop.
Download buttons are disabled; delivery is encrypted and authenticated per request.
$59 · ONE PAYMENT
Own every lesson, for life.
One payment unlocks all 34 lessons instantly — start with lesson one the moment you check out.